Page
Mini-Explainers
This page is for short, visual explanations of ideas that recur across the site. The aim is not to be fully rigorous, but to give an accessible picture that makes the more technical material easier to enter.
Discretizing a Continuous Signal
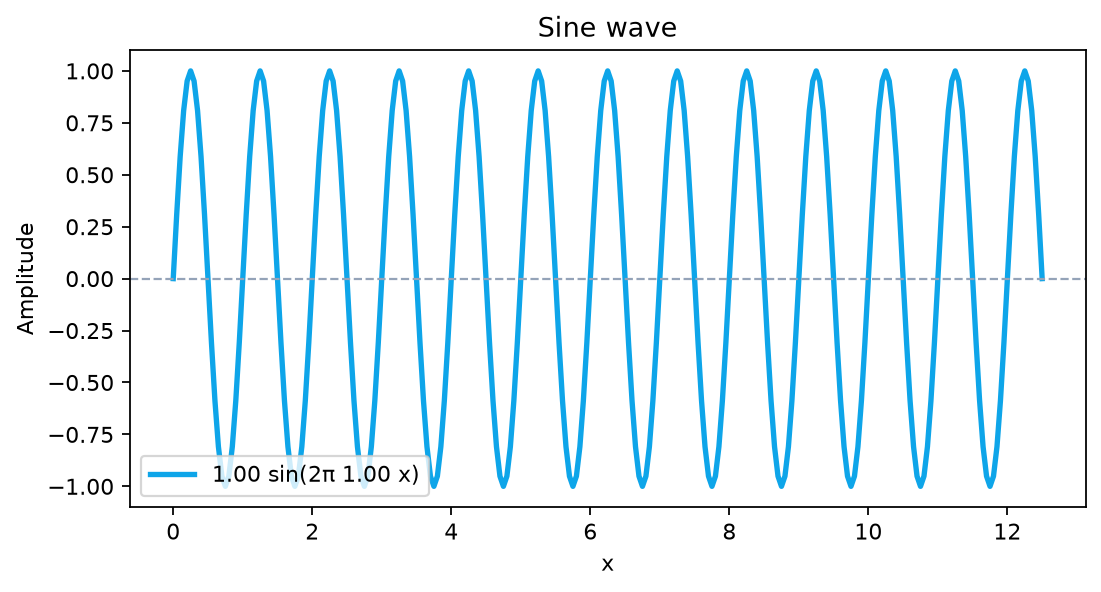
One recurring theme in computational physics is that smooth dynamics have to be represented in a discrete way before a machine can do anything with them. This toy example shows that move in a harmless setting: a simple sine wave sampled point by point.
Sine wave demo
A simple example of turning a smooth signal into a finite set of samples.
amplitude=1.0
frequency=1.0
step=0.05
Output
Generated 251 sample points with amplitude=1.0 and frequency=1.0.Source Code
"""Sine wave demo"""

from math import pi, sin

import matplotlib.pyplot as plt

PARAMS = globals().get("CODE_EXAMPLE_PARAMS", {})
AMPLITUDE = float(PARAMS.get("amplitude", 1.0))
FREQUENCY = float(PARAMS.get("frequency", 1.0))
STEP = float(PARAMS.get("step", 0.05))

sample_count = max(2, int(round(12.5 / STEP)) + 1)
xs = [index * STEP for index in range(sample_count)]
ys = [AMPLITUDE * sin(2 * pi * FREQUENCY * value) for value in xs]

plt.figure(figsize=(7, 3.8))
plt.plot(xs, ys, color="#0ea5e9", linewidth=2.4, label=f"{AMPLITUDE:.2f} sin(2π {FREQUENCY:.2f} x)")
plt.axhline(0.0, color="#94a3b8", linewidth=1, linestyle="--")
plt.xlabel("x")
plt.ylabel("Amplitude")
plt.title("Sine wave")
plt.legend()
plt.tight_layout()
plt.show()

print(f"Generated {len(xs)} sample points with amplitude={AMPLITUDE} and frequency={FREQUENCY}.")
Small Growth, Large Consequences
Another recurring idea in both physics and machine learning is that very simple rules can scale quickly enough to become computationally or conceptually important. This notebook uses the elementary sequence of squares as a stand-in for that broader lesson.
Notebook explainer (small system)
A tiny notebook-backed explainer about how quickly simple structures can grow.
max_n=5
Notebook demo
This notebook is executed during the site build. Its markdown narrative, printed output, and generated plot are embedded into the page.
Errors
Traceback (most recent call last):
  File "/home/runner/work/PersonalSite/PersonalSite/scripts/render_code_examples.py", line 206, in render_notebook
    executed = client.execute()
               ^^^^^^^^^^^^^^^^
  File "/opt/hostedtoolcache/Python/3.11.16/x64/lib/python3.11/site-packages/jupyter_core/utils/__init__.py", line 165, in wrapped
    return loop.run_until_complete(inner)
           ^^^^^^^^^^^^^^^^^^^^^^^^^^^^^^
  File "/opt/hostedtoolcache/Python/3.11.16/x64/lib/python3.11/asyncio/base_events.py", line 654, in run_until_complete
    return future.result()
           ^^^^^^^^^^^^^^^
  File "/opt/hostedtoolcache/Python/3.11.16/x64/lib/python3.11/site-packages/nbclient/client.py", line 693, in async_execute
    async with self.async_setup_kernel(**kwargs):
  File "/opt/hostedtoolcache/Python/3.11.16/x64/lib/python3.11/contextlib.py", line 210, in __aenter__
    return await anext(self.gen)
           ^^^^^^^^^^^^^^^^^^^^^
  File "/opt/hostedtoolcache/Python/3.11.16/x64/lib/python3.11/site-packages/nbclient/client.py", line 648, in async_setup_kernel
    await self.async_start_new_kernel(**kwargs)
  File "/opt/hostedtoolcache/Python/3.11.16/x64/lib/python3.11/site-packages/nbclient/client.py", line 550, in async_start_new_kernel
    await ensure_async(self.km.start_kernel(extra_arguments=self.extra_arguments, **kwargs))
  File "/opt/hostedtoolcache/Python/3.11.16/x64/lib/python3.11/site-packages/jupyter_core/utils/__init__.py", line 214, in ensure_async
    result = await obj
             ^^^^^^^^^
  File "/opt/hostedtoolcache/Python/3.11.16/x64/lib/python3.11/site-packages/jupyter_client/manager.py", line 116, in wrapper
    raise e
  File "/opt/hostedtoolcache/Python/3.11.16/x64/lib/python3.11/site-packages/jupyter_client/manager.py", line 107, in wrapper
    out = await method(self, *args, **kwargs)
          ^^^^^^^^^^^^^^^^^^^^^^^^^^^^^^^^^^^
  File "/opt/hostedtoolcache/Python/3.11.16/x64/lib/python3.11/site-packages/jupyter_client/manager.py", line 528, in _async_start_kernel
    kernel_cmd, kw = await self._async_pre_start_kernel(**kw)
                     ^^^^^^^^^^^^^^^^^^^^^^^^^^^^^^^^^^^^^^^^
  File "/opt/hostedtoolcache/Python/3.11.16/x64/lib/python3.11/site-packages/jupyter_client/manager.py", line 490, in _async_pre_start_kernel
    self.kernel_spec,
    ^^^^^^^^^^^^^^^^
  File "/opt/hostedtoolcache/Python/3.11.16/x64/lib/python3.11/site-packages/jupyter_client/manager.py", line 267, in kernel_spec
    self._kernel_spec = self.kernel_spec_manager.get_kernel_spec(self.kernel_name)
                        ^^^^^^^^^^^^^^^^^^^^^^^^^^^^^^^^^^^^^^^^^^^^^^^^^^^^^^^^^^
  File "/opt/hostedtoolcache/Python/3.11.16/x64/lib/python3.11/site-packages/jupyter_client/kernelspec.py", line 295, in get_kernel_spec
    raise NoSuchKernel(kernel_name)
jupyter_client.kernelspec.NoSuchKernel: No such kernel named python3
Notebook Code
import matplotlib.pyplot as plt

params = globals().get("CODE_EXAMPLE_PARAMS", {})
max_n = int(params.get("max_n", 7))

xs = list(range(max_n + 1))
ys = [value ** 2 for value in xs]

plt.figure(figsize=(6.4, 3.8))
plt.bar(xs, ys, color="#22c55e")
plt.title("Squares")
plt.xlabel("n")
plt.ylabel("n^2")
plt.tight_layout()
plt.show()

print(f"Computed squares up to {max_n}:", ys)
Why These Exist
These explainers are placeholders for a more serious library of notebook-backed essays. For now, they serve as a gentle bridge between plain-language summaries and the more technical research material elsewhere on the site.